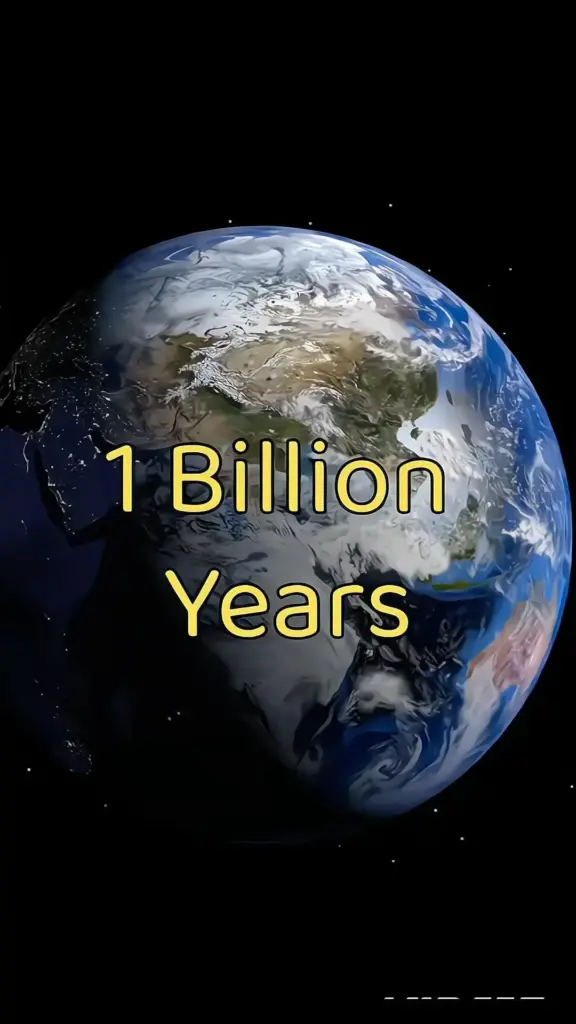
The pin promised the Earth after 1 crore years — 10 million years, written out: 10,000,000. That is roughly 400,000 human generations, or about 2,500 times the length of recorded history. No one has footage of it. What exists instead are models, published projections and simulation tools built by geologists, climatologists and astronomers, each with a stated sample size and date. Below are 16 places to run the calculation yourself, ordered from the closest thing to a direct answer to the wider tools that let you check the working.
Table of Contents(Click to Toggle)
- Why 10 Million Years Is a Checkable Number
- The 16 Tools and Sources
- 1. NASA Eyes on the Solar System
- 2. PaleoMAP Project
- 3. GPlates
- 4. EarthByte
- 5. Astrobiology Magazine Archive (NASA)
- 6. ExoPlaSim
- 7. Climlab
- 8. Wolfram Alpha
- 9. USGS Earthquake Catalog
- 10. Smithsonian Global Volcanism Program
- 11. NASA Earth Observatory
- 12. Timeanddate Duration Calculator
- 13. Our World in Data
- 14. Google Earth Timelapse
- 15. The Paleobiology Database
- 16. Internet Archive Wayback Machine
- Bonus Mentions
- What the Numbers Actually Support
Why 10 Million Years Is a Checkable Number
Ten million years is not a fantasy figure. It sits inside the range that plate tectonics, orbital mechanics and stellar evolution can be modelled with published error bars. Three reference points, each with a date:
- Continental drift: plate motion averages 2–10 cm per year. At 5 cm per year, 10 million years moves a plate 500 km. Africa and Europe have been closing at roughly 1–2 cm per year since the Mediterranean formed, so the model is not speculative at this scale.
- Orbital cycles: the Milankovitch cycles that drive ice ages run on 23,000, 41,000 and 100,000-year periods. Ten million years contains about 100 full 100,000-year cycles.
- Solar luminosity: the Sun brightens about 1% every 110 million years. Over 10 million years that is under 0.1% — small, which is why 10 million years is a modelling problem rather than an astronomy one.
The tools below let you test each of those three lines of reasoning separately.
The 16 Tools and Sources
1. NASA Eyes on the Solar System : Run the orbital clock forward and backward
What it is: A browser-based 3D simulation of the solar system built by NASA’s Jet Propulsion Laboratory, using real ephemeris data.
Category: Astronomy simulation
Why it stands out:
- You can scrub the timeline and watch planetary positions change; the model uses JPL ephemerides rather than animation guesswork.
- Useful for checking the claim that Earth’s obliquity and orbital eccentricity shift on 41,000 and 100,000-year cycles — both fit inside a 10-million-year window about 100 and 250 times respectively.
- Limitation: the interface is built for exploration, not export, so screenshots are the practical output.
Best for: Anyone who wants to see the orbital mechanics behind long-term climate cycles rather than read about them.
2. PaleoMAP Project : Map the continents at any past or future date
What it is: A long-running reconstruction project (data published from the 1990s onward, maintained by the University of Sydney) that renders plate positions for arbitrary geological times.
Category: Geology mapping
Why it stands out:
- Produces maps of continental configuration, which is the single most visible change over 10 million years.
- At 5 cm per year of average motion, 10 million years is 500 km of drift — enough to visibly narrow the Atlantic and shift the Mediterranean.
- Limitation: future projections are extrapolations, not forecasts; the project’s own documentation says so.
Best for: Readers who want a map, not a paragraph, of what the planet looks like later.
3. GPlates : Free desktop software for plate reconstruction
What it is: Open-source software for interactive plate tectonic reconstruction, developed with funding from the Australian Research Council.
Category: Scientific software
Why it stands out:
- Loads real rotation files and coastline datasets, so you can move the clock forward with published parameters instead of a slider.
- Runs offline; the download is a few hundred megabytes and works on Windows, macOS and Linux.
- Limitation: the learning curve is real — expect an hour before the first useful map.
Best for: Anyone who wants to check the arithmetic of continental drift themselves.
4. EarthByte : The data repository behind the maps
What it is: A research group at the University of Sydney publishing open plate-motion datasets and animation files.
Category: Open data
Why it stands out:
- Hosts downloadable rotation models and global plate boundary datasets used by GPlates and PaleoMAP.
- Published animations cover hundreds of millions of years, so the 10-million-year slice is a small, well-constrained section.
- Limitation: files are aimed at researchers; expect CSV and rotation-format files, not infographics.
Best for: People who want the raw numbers rather than a rendered video.
5. NASA Astrobiology Program : Long-horizon habitability research
What it is: NASA’s astrobiology portal, which publishes research summaries on how long Earth remains habitable.
Category: Science reference
Why it stands out:
- Published modelling puts the end of complex life on Earth in the range of roughly 1 billion years from now, driven by solar brightening — a figure far beyond 10 million years, which is useful context.
- Articles are written for general readers with citations attached.
- Limitation: it is a portal, not a calculator; you read, you do not run models.
Best for: Placing a 10-million-year projection inside the longer habitability timeline.
6. ExoPlaSim : Run a climate model on a laptop
What it is: A fast, open-source intermediate-complexity climate model derived from the PLASIM family, designed for exoplanet and paleoclimate work.
Category: Climate modelling
Why it stands out:
- Runs a full year of simulated climate in minutes on ordinary hardware, which is fast enough to test changed continent positions.
- Open source on GitHub with documented parameters for solar constant, rotation rate and topography.
- Limitation: requires Python and comfort with a command line.
Best for: Readers who want to change one variable and see what the climate does.
7. Climlab : Python tools for climate calculations
What it is: A Python package for building and running energy-balance and radiative-convective climate models.
Category: Climate modelling
Why it stands out:
- Lets you test the solar-luminosity change directly: about 1% per 110 million years means under 0.1% over 10 million — a small forcing you can quantify rather than guess.
- Well documented with tutorial notebooks.
- Limitation: it is a library, not an app; there is no interface to click.
Best for: Anyone who wants the radiative calculation written out in code.
8. Wolfram Alpha : Check the arithmetic in one line
What it is: A computational knowledge engine that handles unit conversions and date arithmetic.
Category: Calculation
Why it stands out:
- Type “10 million years in days” and get 3,652,500 days (accounting for leap years) — the base unit for every rate calculation here.
- Handles the drift arithmetic: 5 cm/year × 10,000,000 years = 500 km.
- Limitation: it computes, it does not model; the geology has to come from you.
Best for: Sanity-checking any figure quoted in a video before repeating it.
9. USGS Earthquake Catalog : The real-time record of plate motion
What it is: The United States Geological Survey’s searchable earthquake database, updated continuously.
Category: Geoscience data
Why it stands out:
- Earthquakes mark plate boundaries, which is the mechanism that produces the 500 km of drift over 10 million years.
- You can filter by magnitude, depth and date and export CSV.
- Limitation: it records the present, not the future; it is evidence for the rate, not the outcome.
Best for: Seeing where the planet is currently deforming.
10. Smithsonian Global Volcanism Program : Volcanism as a long-term climate input
What it is: The Smithsonian’s database of Holocene and Pleistocene eruptions, maintained since the 1960s.
Category: Geoscience data
Why it stands out:
- Documents how large eruptions inject sulphur into the stratosphere and cool the surface for 1–3 years — a short-term effect that repeats many times across 10 million years.
- Records are dated and sourced, with eruption magnitude indices.
- Limitation: the database is historical; future volcanism is inferred, not listed.
Best for: Understanding the noise around any long-term climate trend.
11. NASA Earth Observatory : Satellite evidence for the baseline
What it is: NASA’s public archive of satellite imagery and explanatory articles, publishing daily since 1999.
Category: Earth observation
Why it stands out:
- Provides the measured baseline — ice extent, vegetation, aerosol — that any 10-million-year projection is built on.
- Images are public domain and dated.
- Limitation: coverage is the present and recent past; projections live elsewhere.
Best for: Grounding the projection in measured data rather than narration.
12. Timeanddate Duration Calculator : Convert the timescale honestly
What it is: A free date and duration calculator covering days, hours and seconds.
Category: Utility
Why it stands out:
- Ten million years is 3,652,500,000 days; at one second per day it would take 115 years to count them aloud.
- Useful for converting geological rates into human-comprehensible units.
- Limitation: it is a calculator, so the framing is entirely yours.
Best for: Making the scale of 10 million years legible.
13. Our World in Data : Long-run charts with sources attached
What it is: A research publication at Oxford that hosts long-run datasets with citations and download links.
Category: Data reference
Why it stands out:
- Every chart carries its source and date, which is the standard this article is applying.
- Covers population, energy and land use — the human variables that matter for the near part of any long projection.
- Limitation: its horizon is decades to centuries, not millions of years.
Best for: Checking the human-scale numbers before scaling up.
14. Google Earth Timelapse : Four decades of change in one scrub
What it is: A global timelapse built from satellite imagery, covering 1984 to the present.
Category: Earth observation
Why it stands out:
- Shows measurable change over 40 years — a rate you can compare against the 10-million-year extrapolation.
- Free, no account needed, and the imagery is dated.
- Limitation: 40 years is 0.0004% of 10 million, so it is a baseline, not a preview.
Best for: Seeing the rate of change at human scale before scaling it up.
15. The Paleobiology Database : What lived, where, and when
What it is: A collaborative database of fossil occurrences maintained by an international group of researchers.
Category: Paleontology data
Why it stands out:
- Lets you query species distributions by geological period, which is how you test claims about what survives a shift in continents.
- Records are sourced and dated, with taxonomic classification.
- Limitation: the data is the past; the future is inference.
Best for: Anyone asking what a changed map means for living things.
16. Internet Archive Wayback Machine : Check whether the claim has changed
What it is: A non-profit archive of web pages, with snapshots dating back to 1996.
Category: Reference archive
Why it stands out:
- Lets you compare how a projection was described ten years ago against how it is described now — a useful test for whether a number is stable or drifting.
- Free and needs no account.
- Limitation: coverage is patchy for older or niche pages.
Best for: Verifying whether a figure is a settled estimate or a recycled one.
Bonus Mentions
USGS : Government geoscience publications
Long-form reports on tectonics and geologic time, free to download and dated.
NASA Solar System Exploration : Planetary science explainers
Background on orbital mechanics written for non-specialists.
Natural History Museum : Deep-time explainers
Accessible summaries of extinction and geological period data.
British Geological Survey : Open geology datasets
Maps and borehole data for checking local geology against global models.
What the Numbers Actually Support
Three figures survive scrutiny. Plate motion of 2–10 cm per year gives 200–1,000 km of drift over 10 million years. Orbital cycles of 23,000, 41,000 and 100,000 years give roughly 100 full cycles. Solar brightening of about 1% per 110 million years gives under 0.1%, which is small enough that the astronomy is not the interesting variable — the geology is. Anything beyond those three, presented without a model and a date, is narrative rather than projection.
Which of these tools gave you a number you had not seen before? Show the working.

Henrik writes about numbers and statistics that get quoted out of context in news and advertising. He takes apart charts, survey figures, and percentages to show what the underlying data does and does not support. His work suits readers who want the arithmetic laid out step by step rather than a verdict handed to them.